Comp578 Susan Portugal Fall 2008
Assignment 9 October 30, 2008
8.7.1
Consider a data set consisting of 2^20 data vectors, were each vector has 32 components and each component is a 4-byte value. Suppose that vector quantization is used for compression and that 2^16 prototype vectors are used. How many bytes of storage does that data set take before and after compression and what is the compression ratio?
Orginial Data Set: 2^20 x 32 x 4 = 134217728
New Data Set: 2^16 x 32 x 4 = 8388608
Compression Ratio: [Uncompressed Size] / [Compressed Size] = Uncompressed Size : Compressed Size
[134217728] / [8388608] = 16 : 1
8.7.2
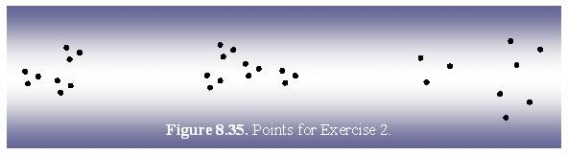
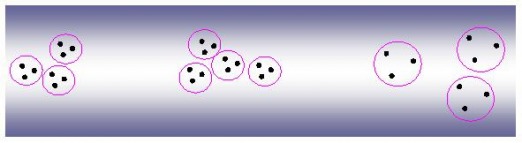
Find all well-separated clusters in the set of points shown in Figure 8.35
8.7.3
Many partitioning clustering algorithms that automatically determine the number of clusters claim that this is an advantage. List 2 situations in which this is not the case.
(1) One situation that is not an advantage for automatic clustering is when the number of clusters calculated is greater than the system can handle. (2) The second situation that is not an advantage for automatic clustering when the data set is known and therefore running the algorithm doesn’t not return any additional information.
8.7.4
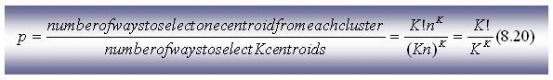
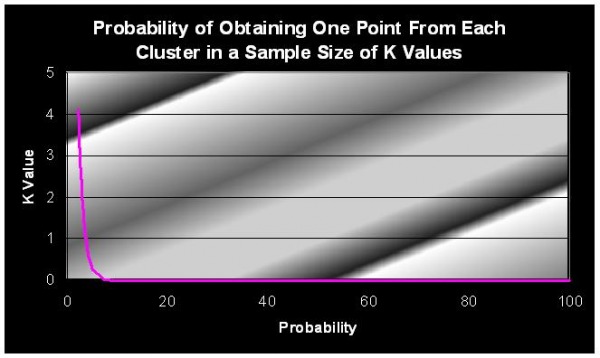
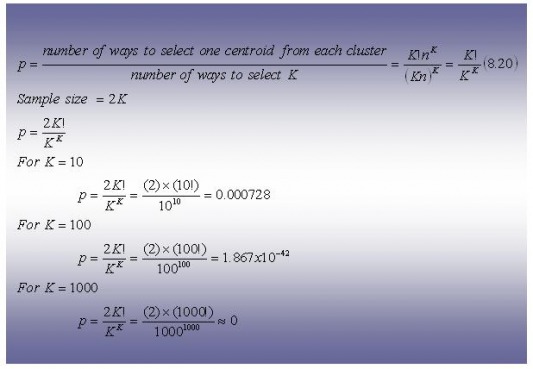
Given K equally sized clusters, the probability that a randomly chosen initial centroid will come from any given cluster is 1/k, but the probability that each cluster will have exactly 1 initial centroid is much lower. (It should be clear that having 1 initial centroid in each cluster is a good starting situation for K-means.) In general, if there are K clusters and each cluster has n points, then the probability, p, of selecting in a sample of size K one initial centroid from each cluster is given by Equation 8.20. (This assumes sampling with replacement.) From this formula we can calculate, for example, that the chance of having on e initial centroid from each of 4 clusters is 4!/4^4 = 0.0938.
(a) Plot the probability of obtaining one point from each cluster in a sample of size K for values of K between 2 and 100.
(b) For K clusters, K – 10,100, and 1000, find the probability that a sample of size 2K contains at least one point from each cluster. You can use either mathematical methods or statistical simulation to determine the answer.
8.7.5
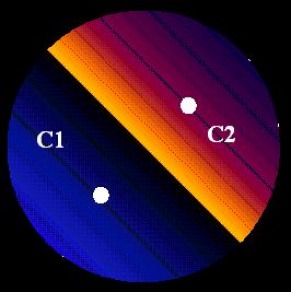
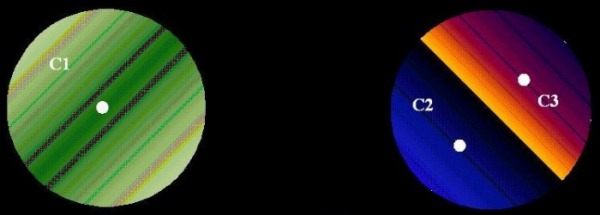
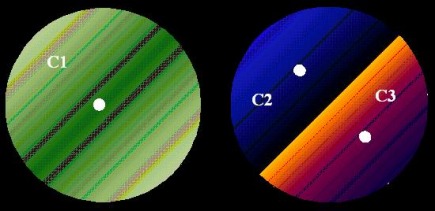
Identify the clusters in Figure 8.36 using the center-, contiguity-, and density-based definitions. Also, indicate the number of clusters for each case and give a brief indication of your reasoning. Note that darkness or the number of dots indicates density. If it helps, assume center-based means K-means, contiguity based means single link, and density0based means DBSCAN.
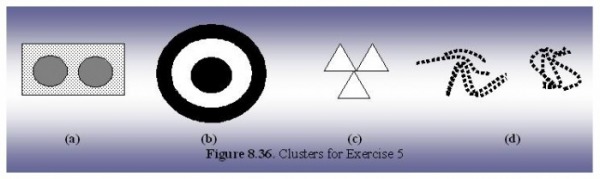
Figure (a) the density-based definition clustering defines the clustering type with the main two clusters have a high density with the remaining surrounding area has a lower density for the three clusters within the figure.
Figure (b) the density-based definition clustering defines the cluster type with the larger outer ring and the inner circle clusters. The ring just outlining the center circle has a lower density which would fit into the center-based definition.
Figure (c) the center-based definition defines the cluster type with each triangle defined as an individual cluster. Center-based definition is chosen due to each triangle, cluster, contains the sample center point.
Figure (d) the continuity-based definition defines the cluster with two clusters. The two clusters that are within the figure is divided by the lower density area between the two sections.
8.7.6
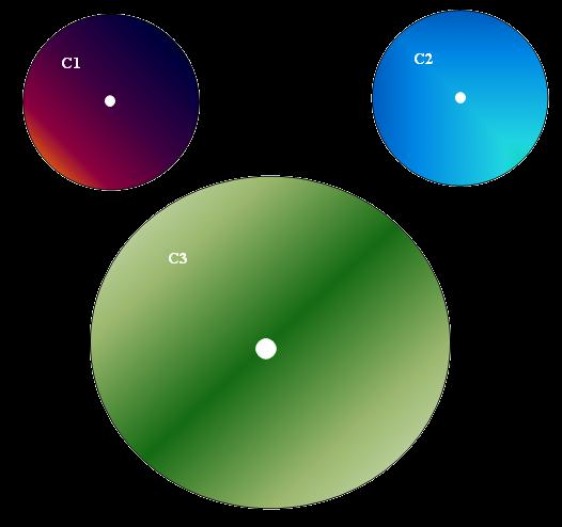
For the following sets of 2-dimensional points, (1) provide a sketch of how they would be split into clusters by K-means for the given number of clusters and (2) indicate approximately where the resulting centroids would be . Assume that we use a squared error objective function. If you think that there is more than 1 possible solution, then please indicate whether each solution is a global or a local minimum. Note that the label in each diagram in Figure 8.37 matches the corresponding part of this questions.
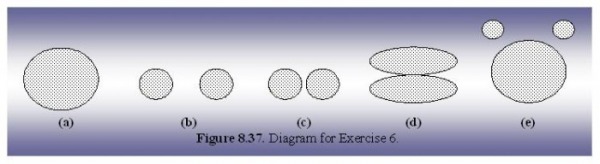
(a) K=2. Assuming that the points are uniformly distributed in the circle, how many possible ways are there (in theory) to partition the points tine 2 choices? (Again, you don’t need to provide exact centroid locations, just a qualitative description.)
Assuming the points are uniformly distributed in the circle, with K=2 theoretically circle can be partition into two half circles. When positioning the two centroids, they would be placed (as depicted in the figure below) in the center of each half circle.
(b) K=3. The distance between the edges of the circles us slightly greater that the radii of the circles.
Pertaining to figure (b) if K=3 the following figure below depicts one possible situation for the placement of the three centroids.
(c) K=3. The distance between the edges of the circles is much less than the radii of the circles.
Pertaining to figure (b) if K=3 the following figure below depicts one possible situation for the placement of the three centroids.
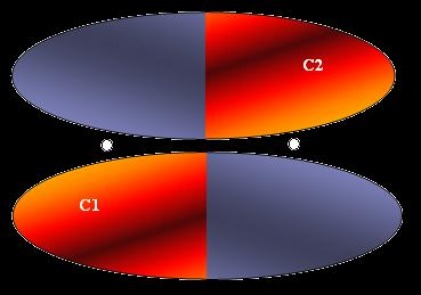
(d) K=2.
If K=2, the centroids would be located between the elipses as depicted below in the figure.
(e) K=3. Hint: Use the symmetry of the situation and remember that we are looking for a rough sketch of what the result would be.
If K=3, the centroids for figure (e) would be located in the center of each cluster. The figure below depicts the locationg of the centroids.