Comp578 Susan Portugal Fall 2008
Assignment 8 October 23, 2008
7.8.1
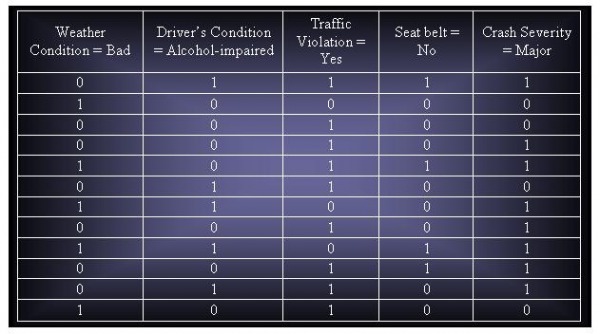
Consider the traffic accident data set shown in Tale 7.10
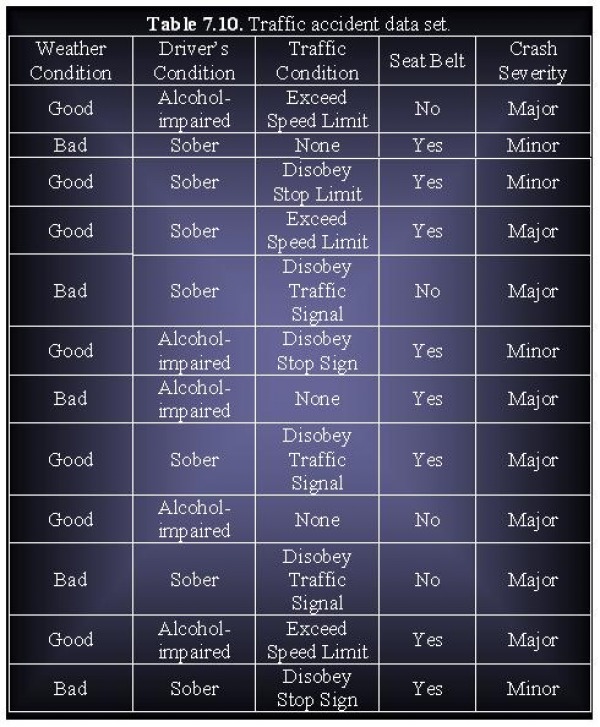
(a) Show a binarized version of the data set.
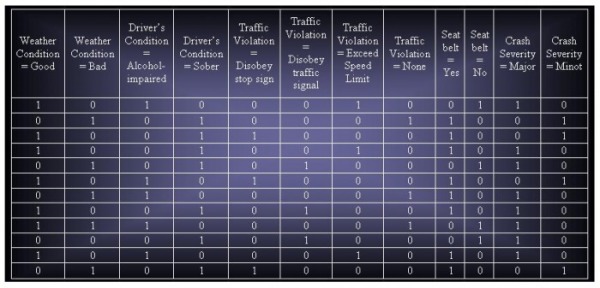
Select the table above for easier viewing.
(b) What is the maximum width of each transaction in the binarized data?
The maximum width of each transaction in the binarized data sheet is number of attributes in the orginial data which is 5.
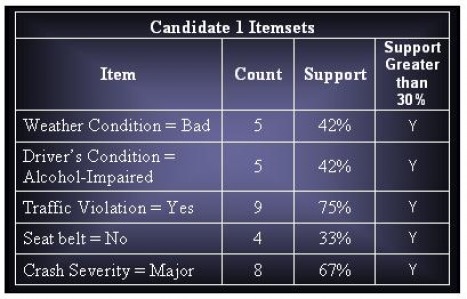
(c) Assuming that support threshold is 30%, how many candidate and frequent item sets are there?
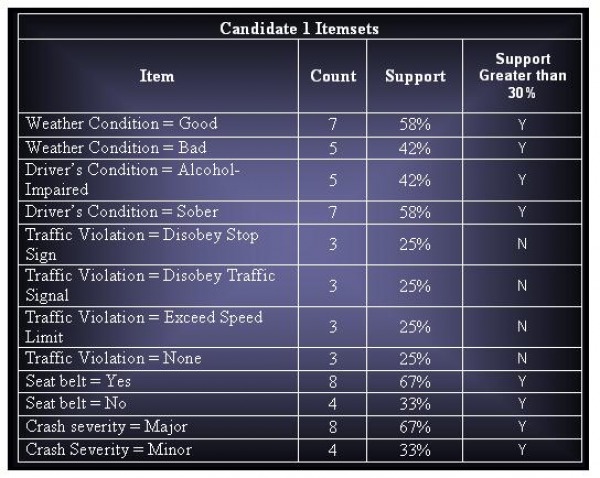
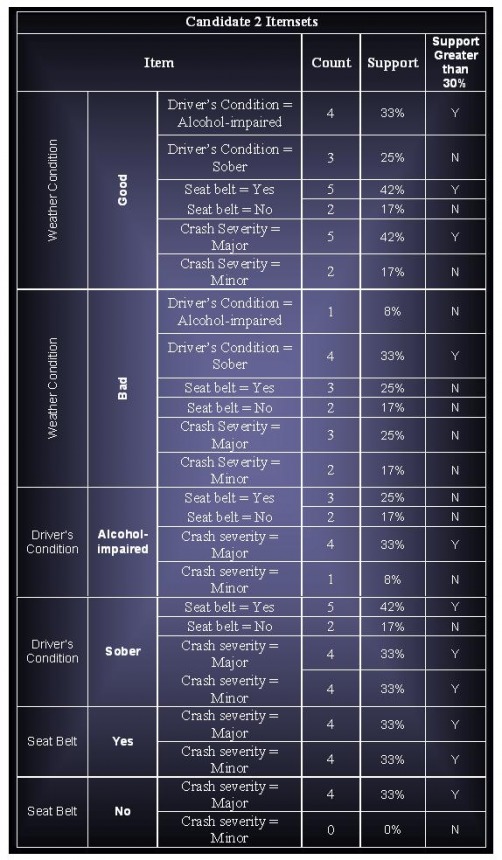
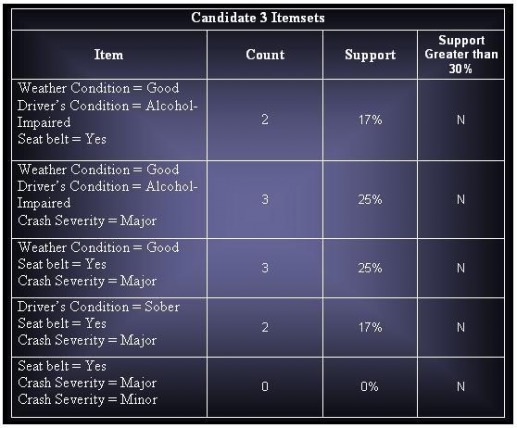
Candidates Itemsets : 45
Total Frequent Itemsets : 18
(d) Create a data set that contains only the following asymmetric binary attributes: (Weather=bad, Driver’s condition=Alcohol-impaired, Traffic violation = Yes, Seat Belt – No, Crash Severity =Major). For Traffic violation, only None has a value of 0. The rest of the attribute values are assigned to 1. Assuming that support threshold is 30%, how many candidate and frequent itemsets will be generated?
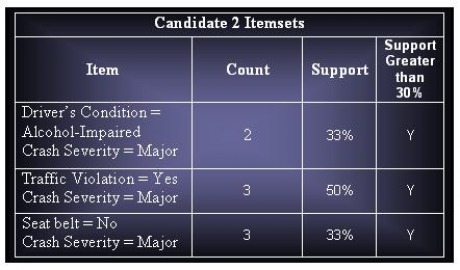
Candidate Itemsets : 15
Total Frequent Itemsets : 8
(e) Compare the number of candidate and frequent itemsets generated in parts (c) and (d).
Comparing the number of candiates and frequent itemsets generated the following :
Part (c)
Candidate Itemsets : 45
Total Frequent Itemsets : 18
Part (d)
Candidate Itemsets : 15
Total Frequent Itemsets : 8
7.8.2 (a) Consider the data set shown in Table 7.11. Suppose we apply the following discretization strategies to the continuous attributes of the data set.
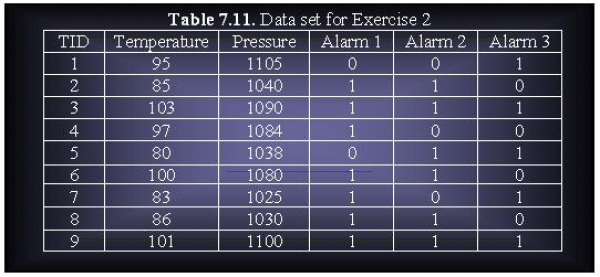
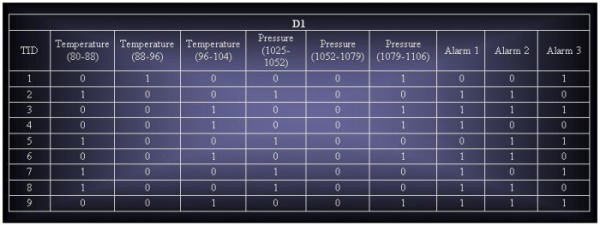
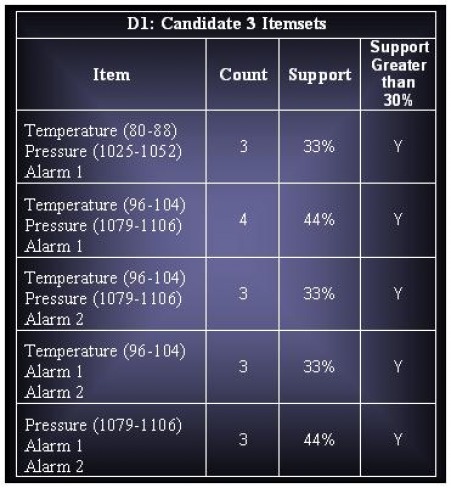
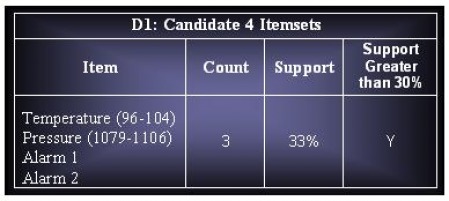
D1: Partition the range of each continuous attribute into 3 equal-sized bins.
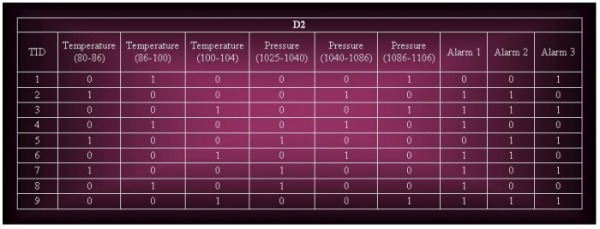
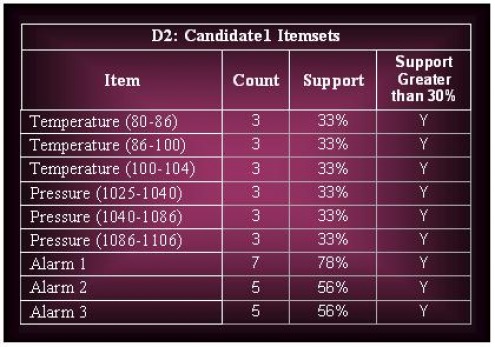
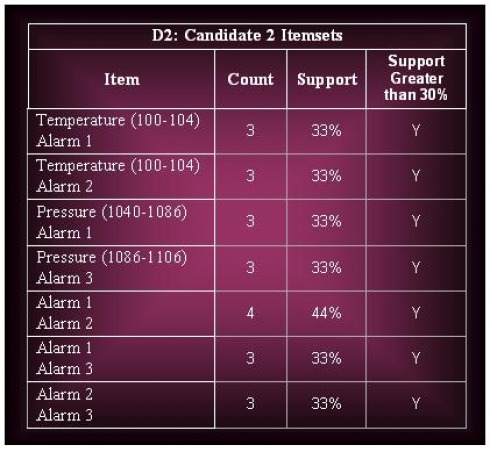
D2: Partition the range of each continuous attribute into 3 bins; where each bin contains an equal number of transactions.
For each strategy, answer the following questions:
i. Construct a binarized version of the data set.
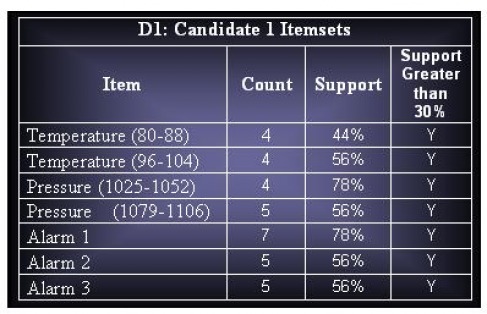
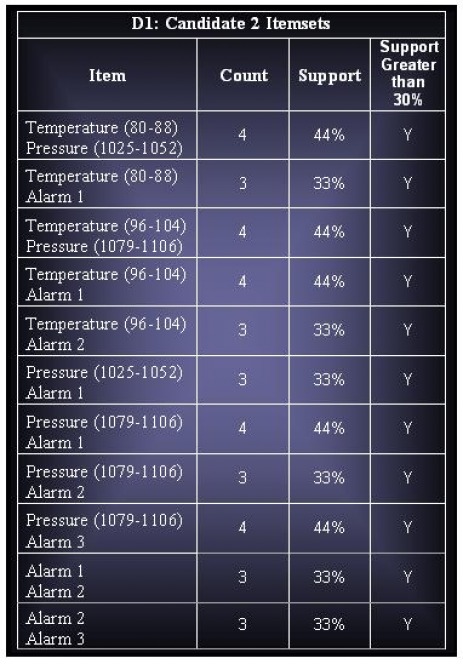
ii. Derive all the frequent itemsets having support ≥ 30%.
(b) The continuous attribute can also be discretized using a clustering approach.
i. Plot a graph of temperature versus pressure for the data points shown in Table 7.11.
ii. How many natural clusters do you observe from the graph? Assign a label (C1, C2, etc.) to each cluster in the graph.
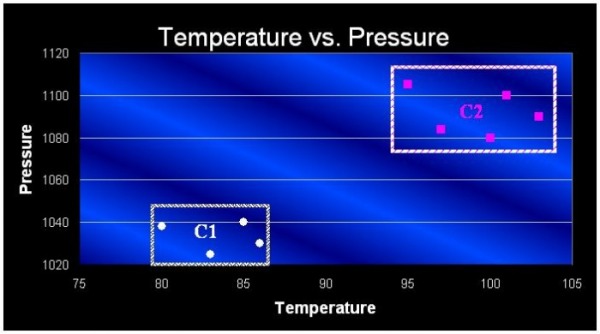
iii. What type of clustering algorithm do you think can be used to identify the clusters? State your reasons clearly.
The type of clustering algorithm that can be used to identify the clusters would be K-means clustering algorithm. K-means is chosen due to the two clusters are well defined with the centroid easily determined.
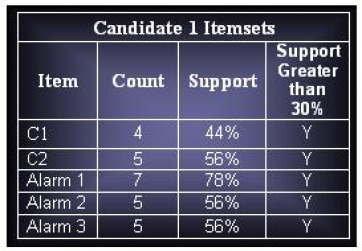
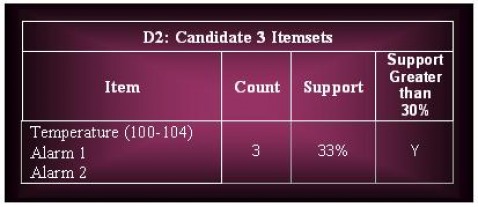
iv. Replace the temperature and pressure attributes in Table 7.11 with asymmetric binary attributes C1, C2, etc. Construct a transaction matrix using the new attributes (along with attributes Alarm1, Alarm 2 and Alarm 3).
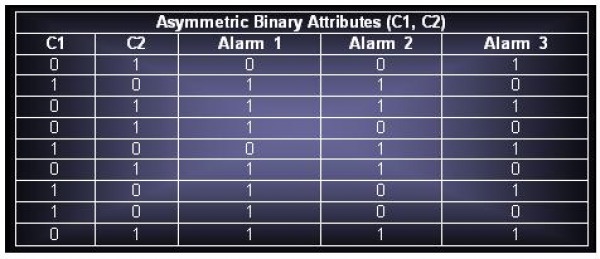
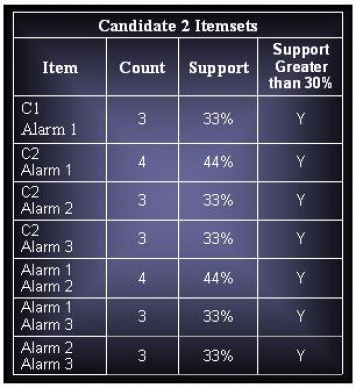
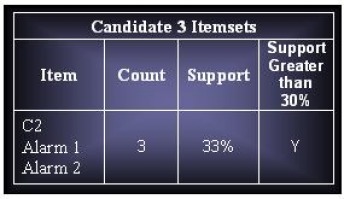
v. Derive all the frequent itemsets having support ≥30% from the binarized data.